Debugging an Application with OpenShift Toolkit
Debugging is an unavoidable part of development, and it can prove even more difficult when developing an application that runs remotely in containers.
However, this task is made absurdly simple with the help of the OpenShift Toolkit IDE plugin.
OpenShift Toolkit
OpenShift Toolkit is an IDE plugin available on VS Code and JetBrains IDEs, that allows you to do all things that odo does, i.e. create, test, debug and deploy cloud-native applications on a cloud-native environment in simple steps.
odo enables this plugin to do what it does.
Prerequisites
- You have logged in to your cluster.
- You have initialized an application with
odo, for example the Node.JS quickstart application.noteThis tutorial uses a Node.js application, but you can use any application that has Devfile with debug command defined in it. If your Devfile does not contain a debug command, refer to Configure Devfile to support debugging.
- You have installed the OpenShift Toolkit Plugin in your preferred VS Code or a JetBrains IDE. This tutorial uses VSCode, but the steps are similar for a JetBrains IDE.
- You have opened the application in the IDE.
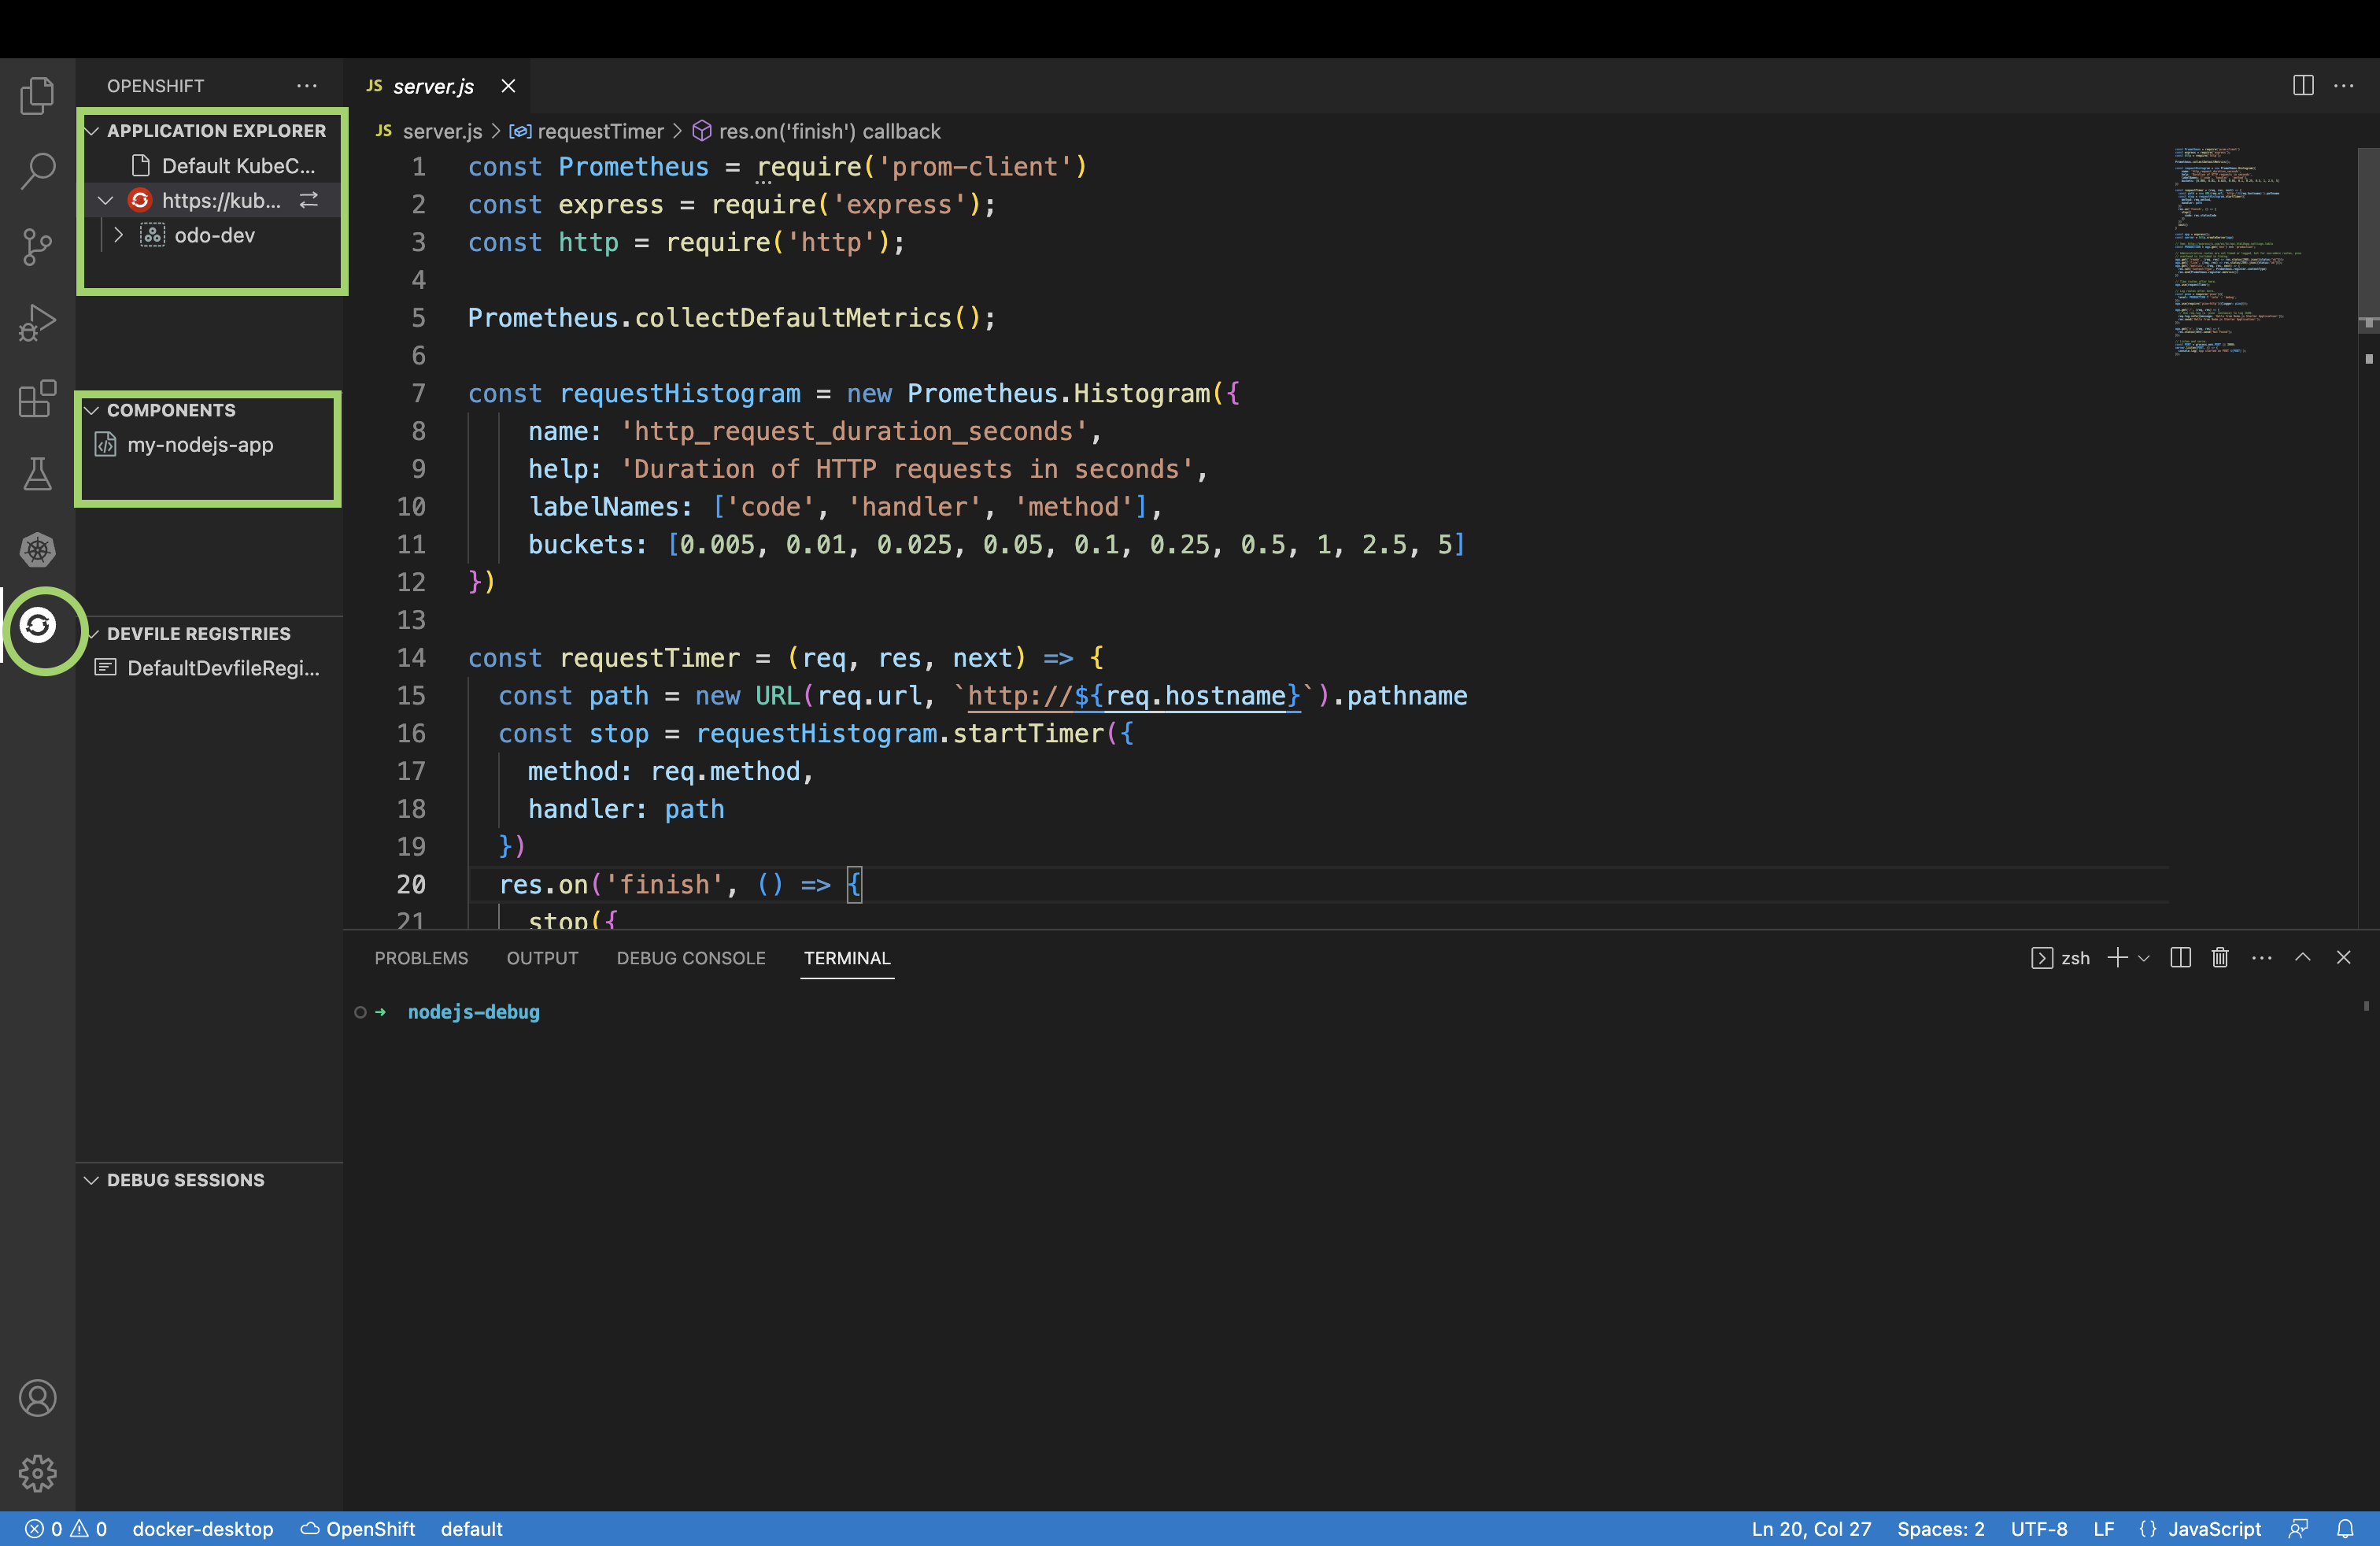
In the plugin window, you should be able to see the cluster you are logged into in "APPLICATION EXPLORER" section, and your component "my-nodejs-app" in "COMPONENTS" section.
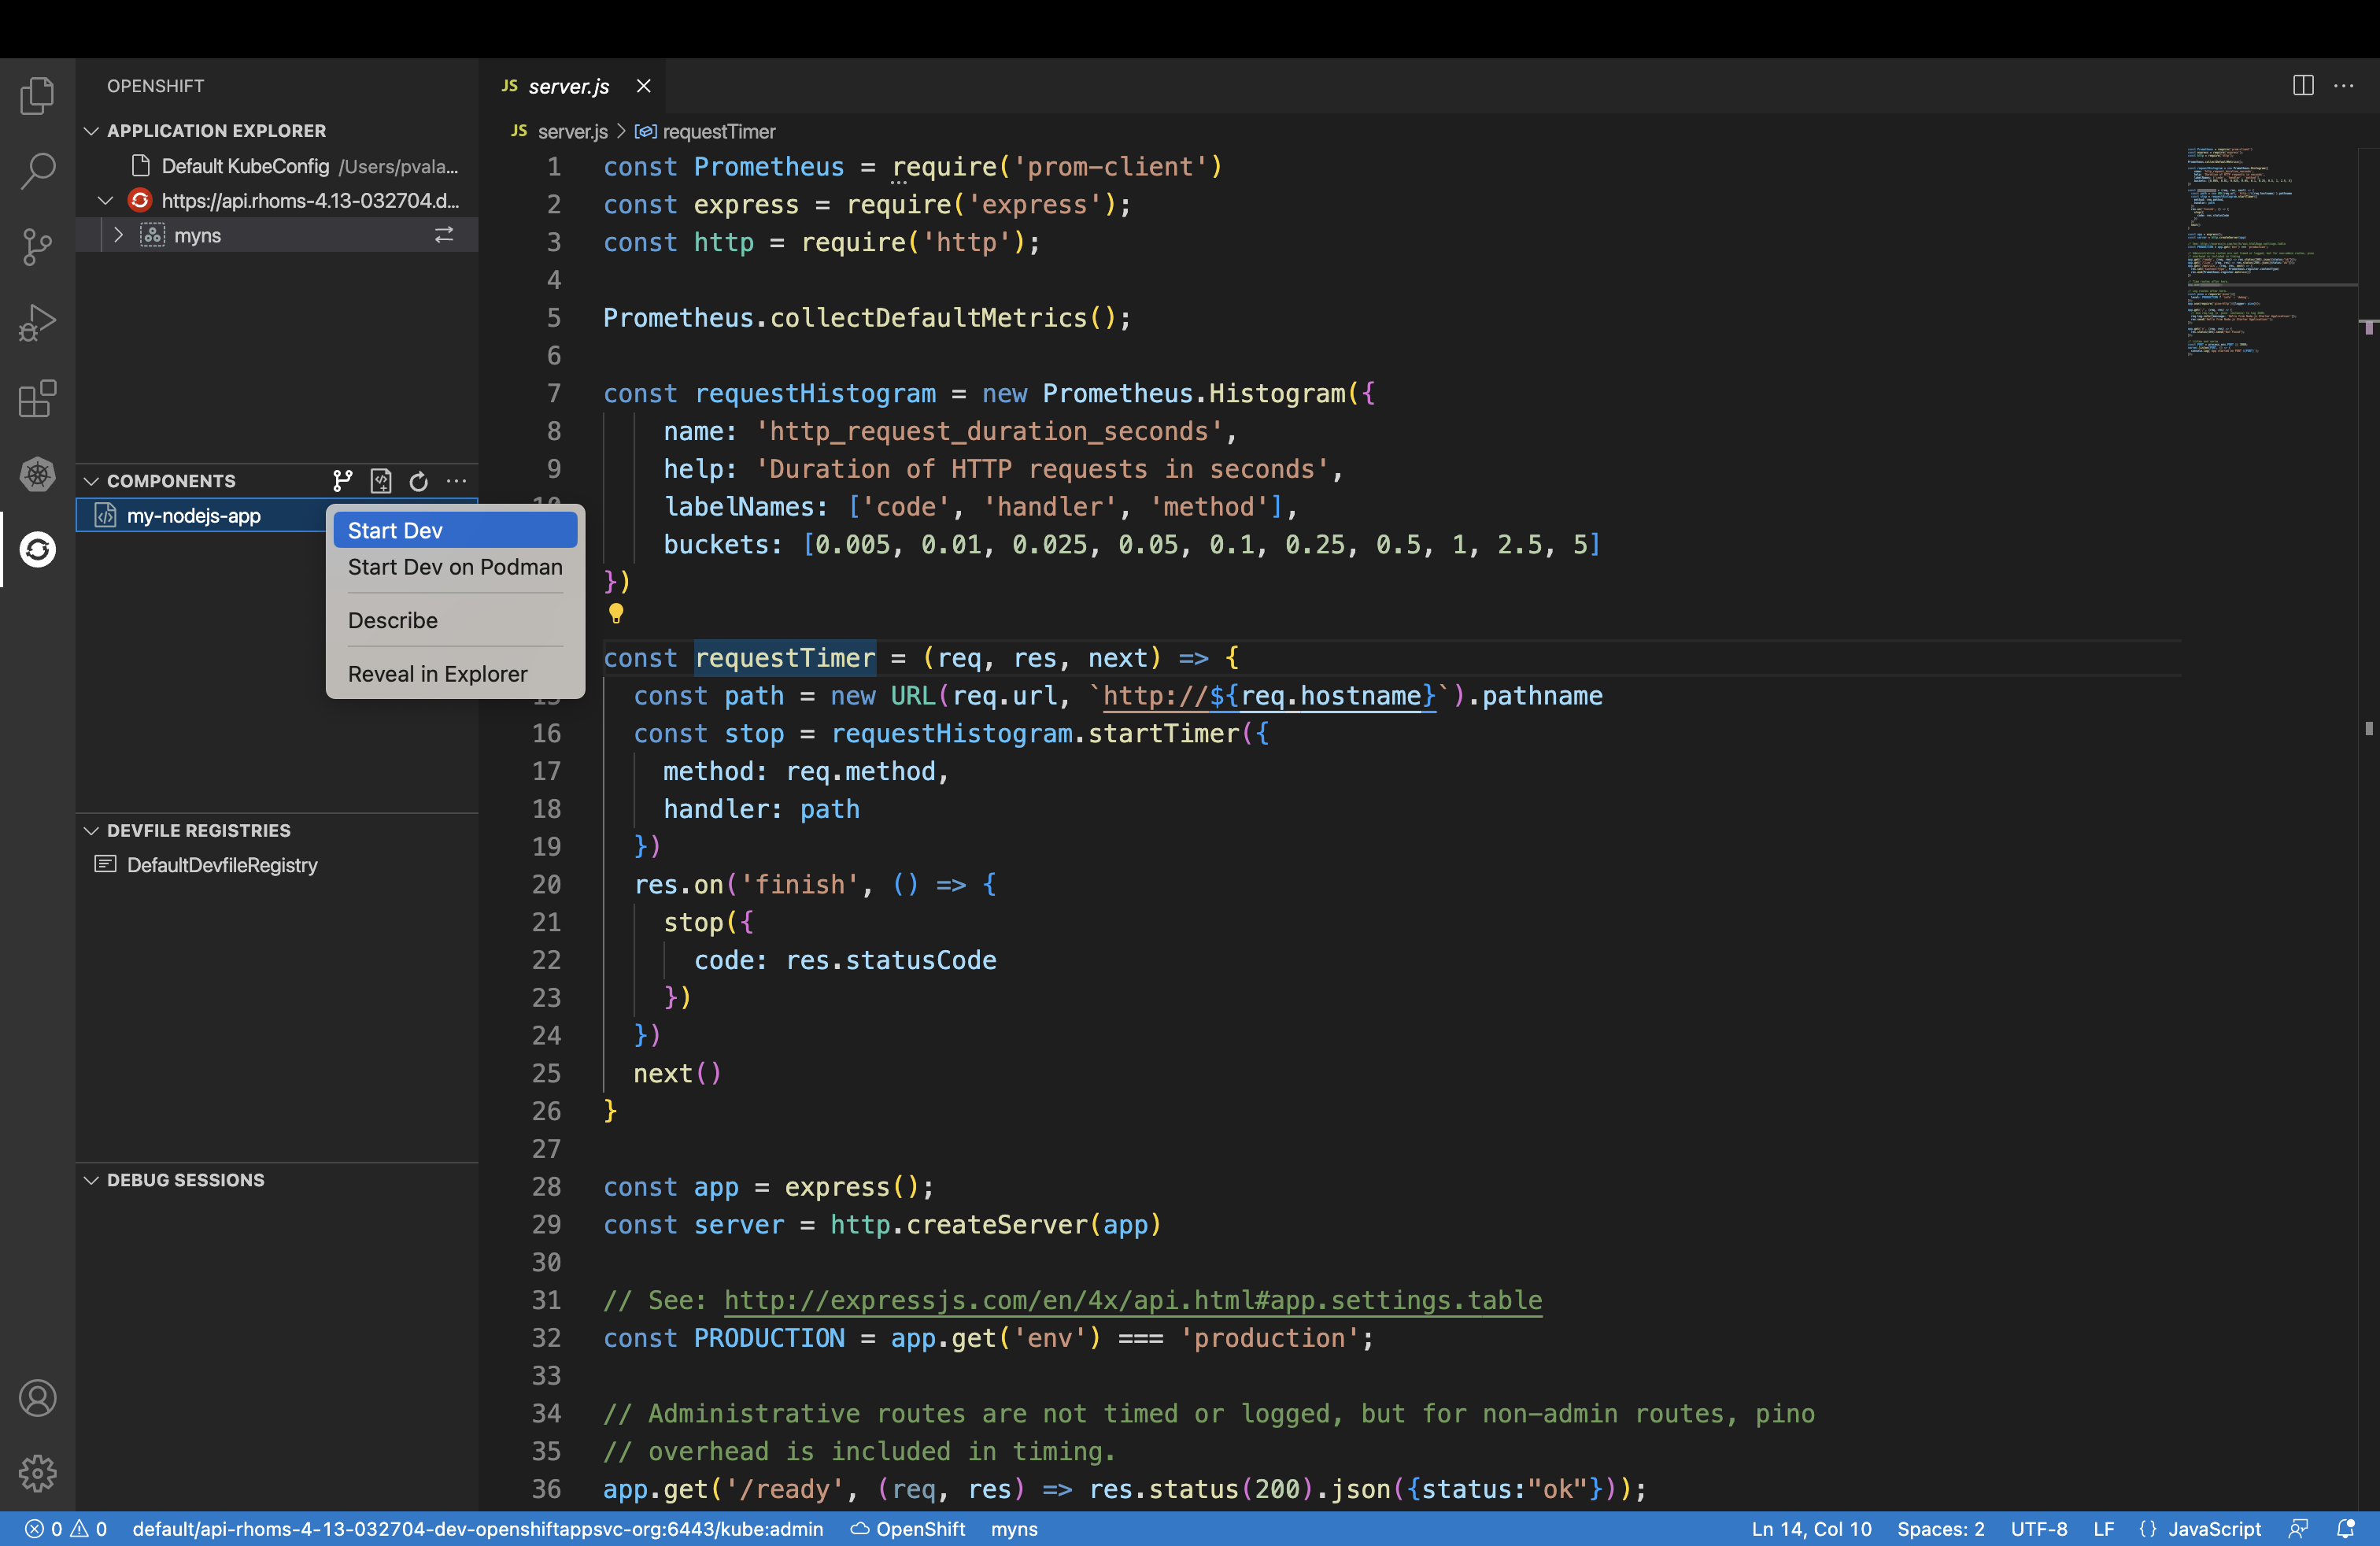
Step 1. Start the Dev session to run the application on cluster
- Right click on "my-nodejs-app" and select "Start on Dev".
- Wait until the application is running on the cluster, i.e. until you see "Keyboard Commands" appear in your "TERMINAL" window.
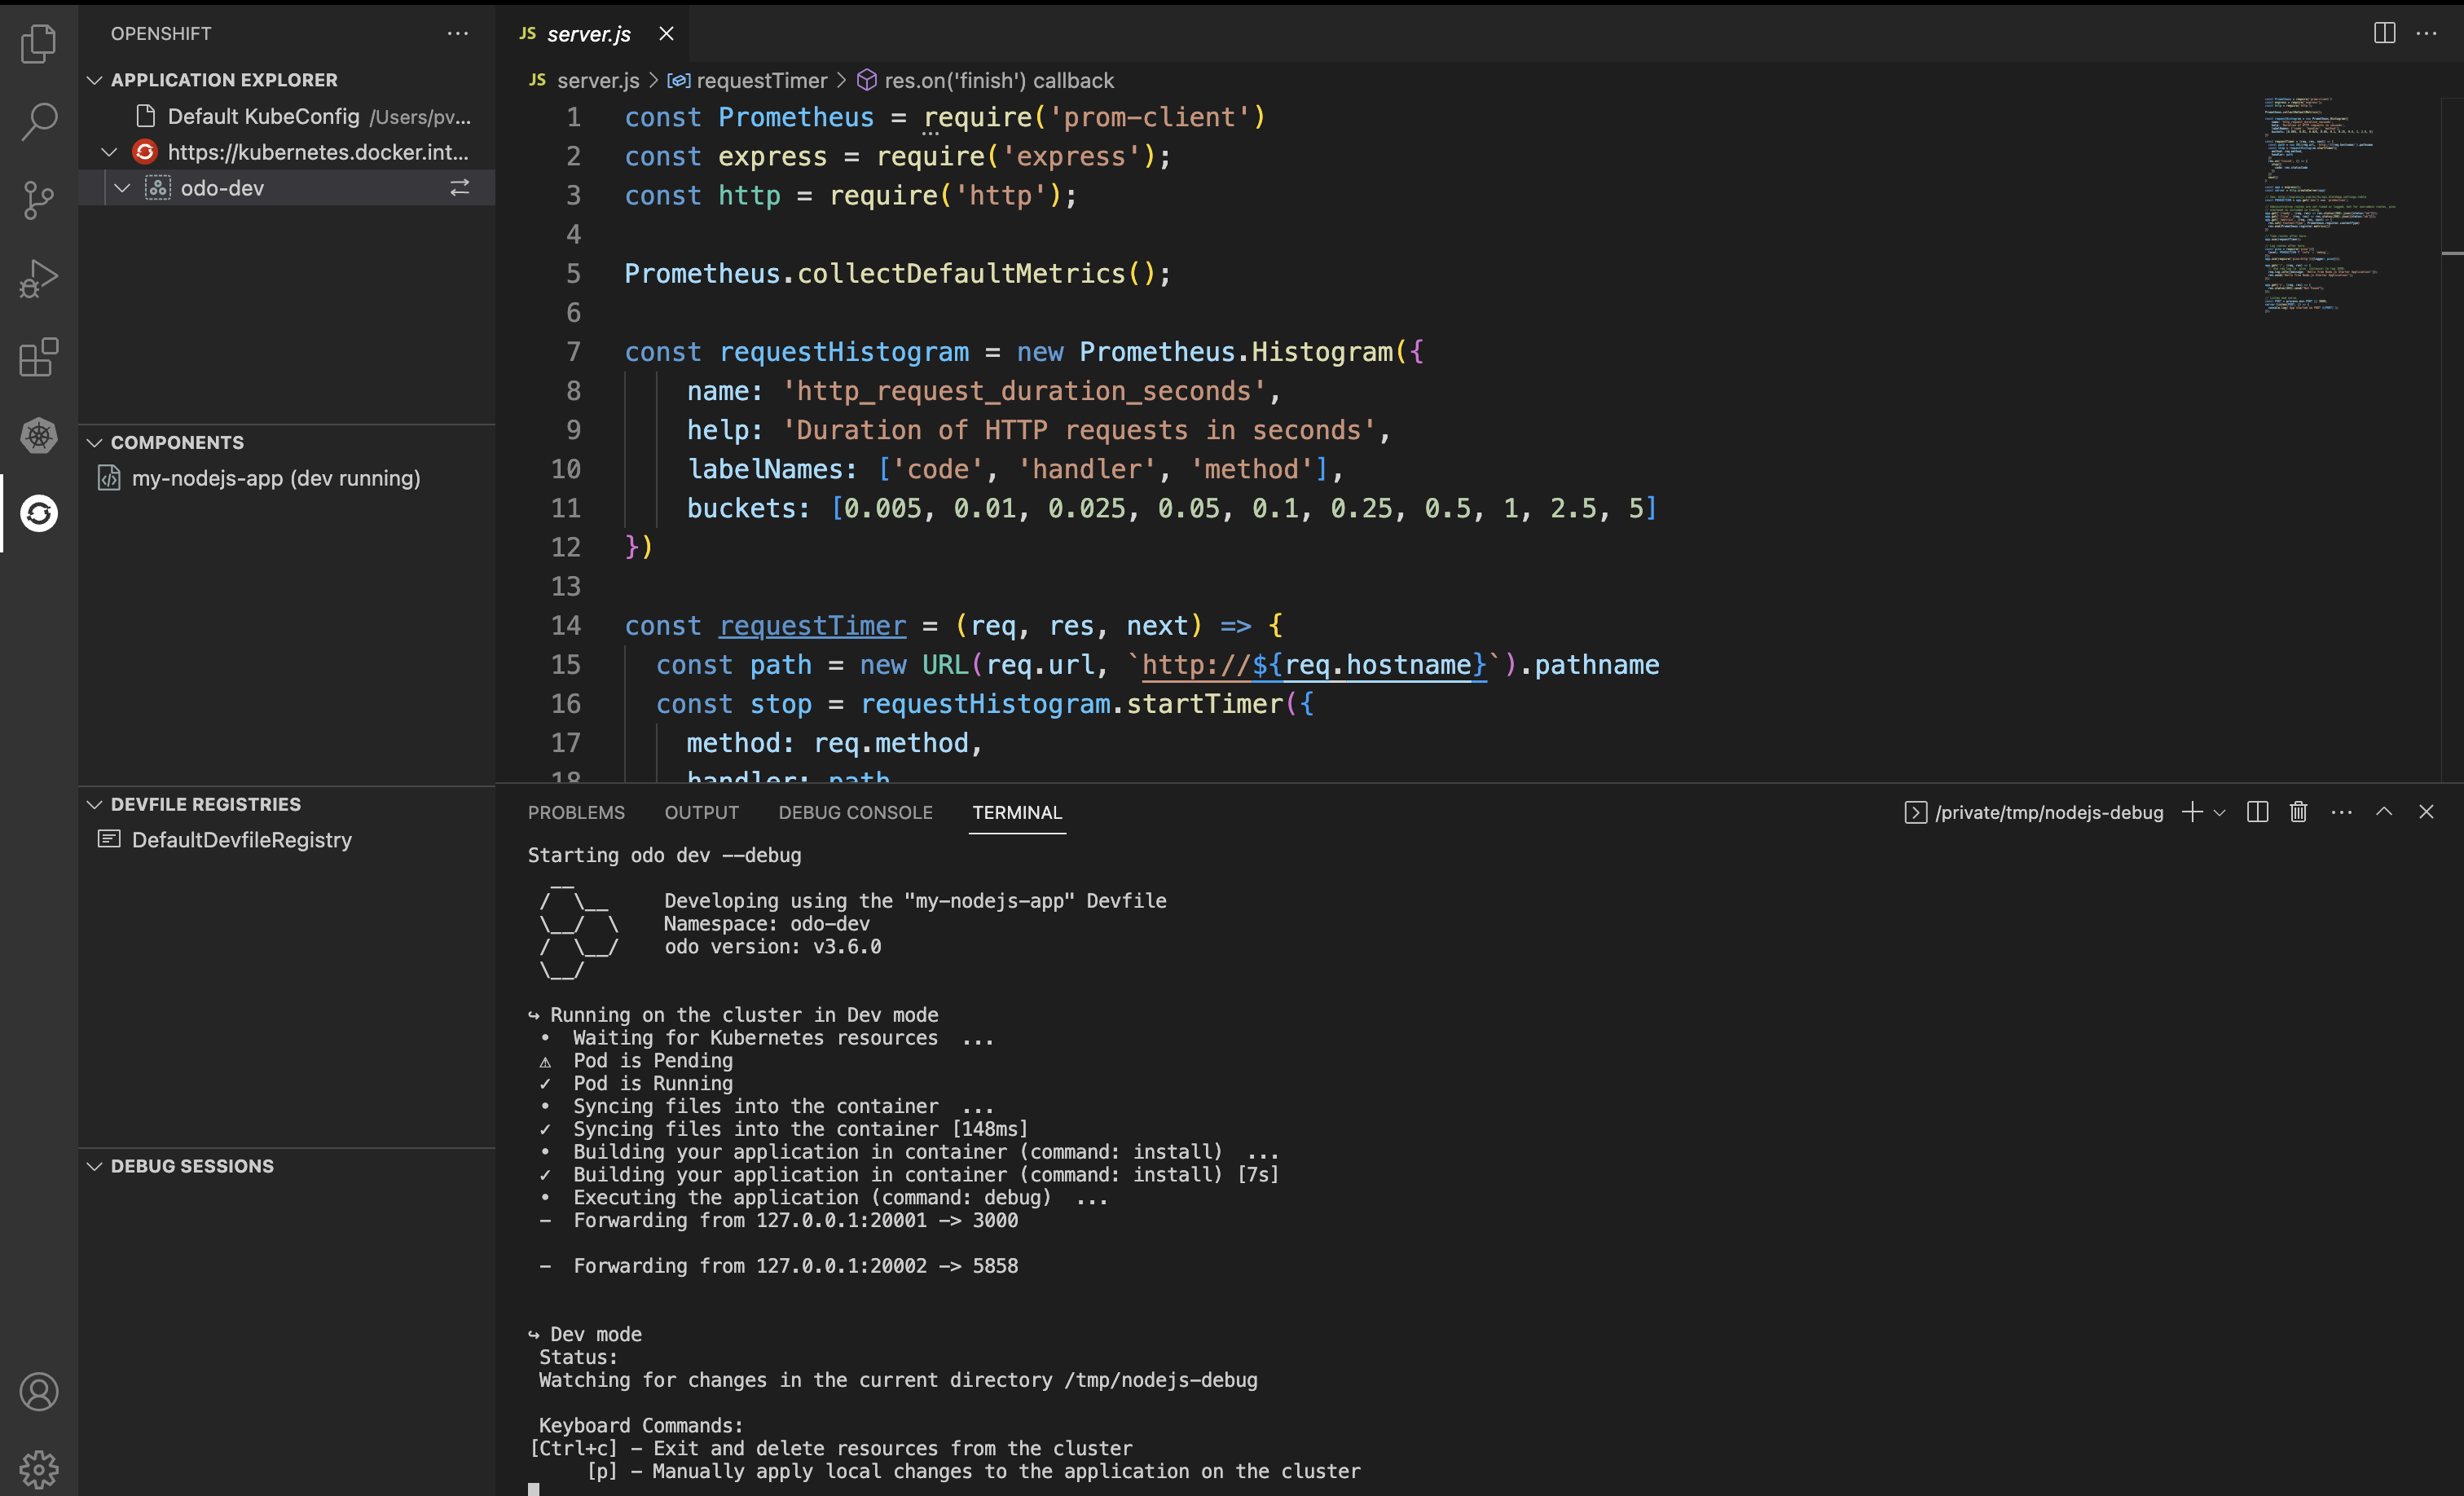
Our application is now available at 127.0.0.1:20001. The debug server is available at 127.0.0.1:20002.
Step 2. Start the Debugging session
- Right click on "my-nodejs-app" and select "Debug".
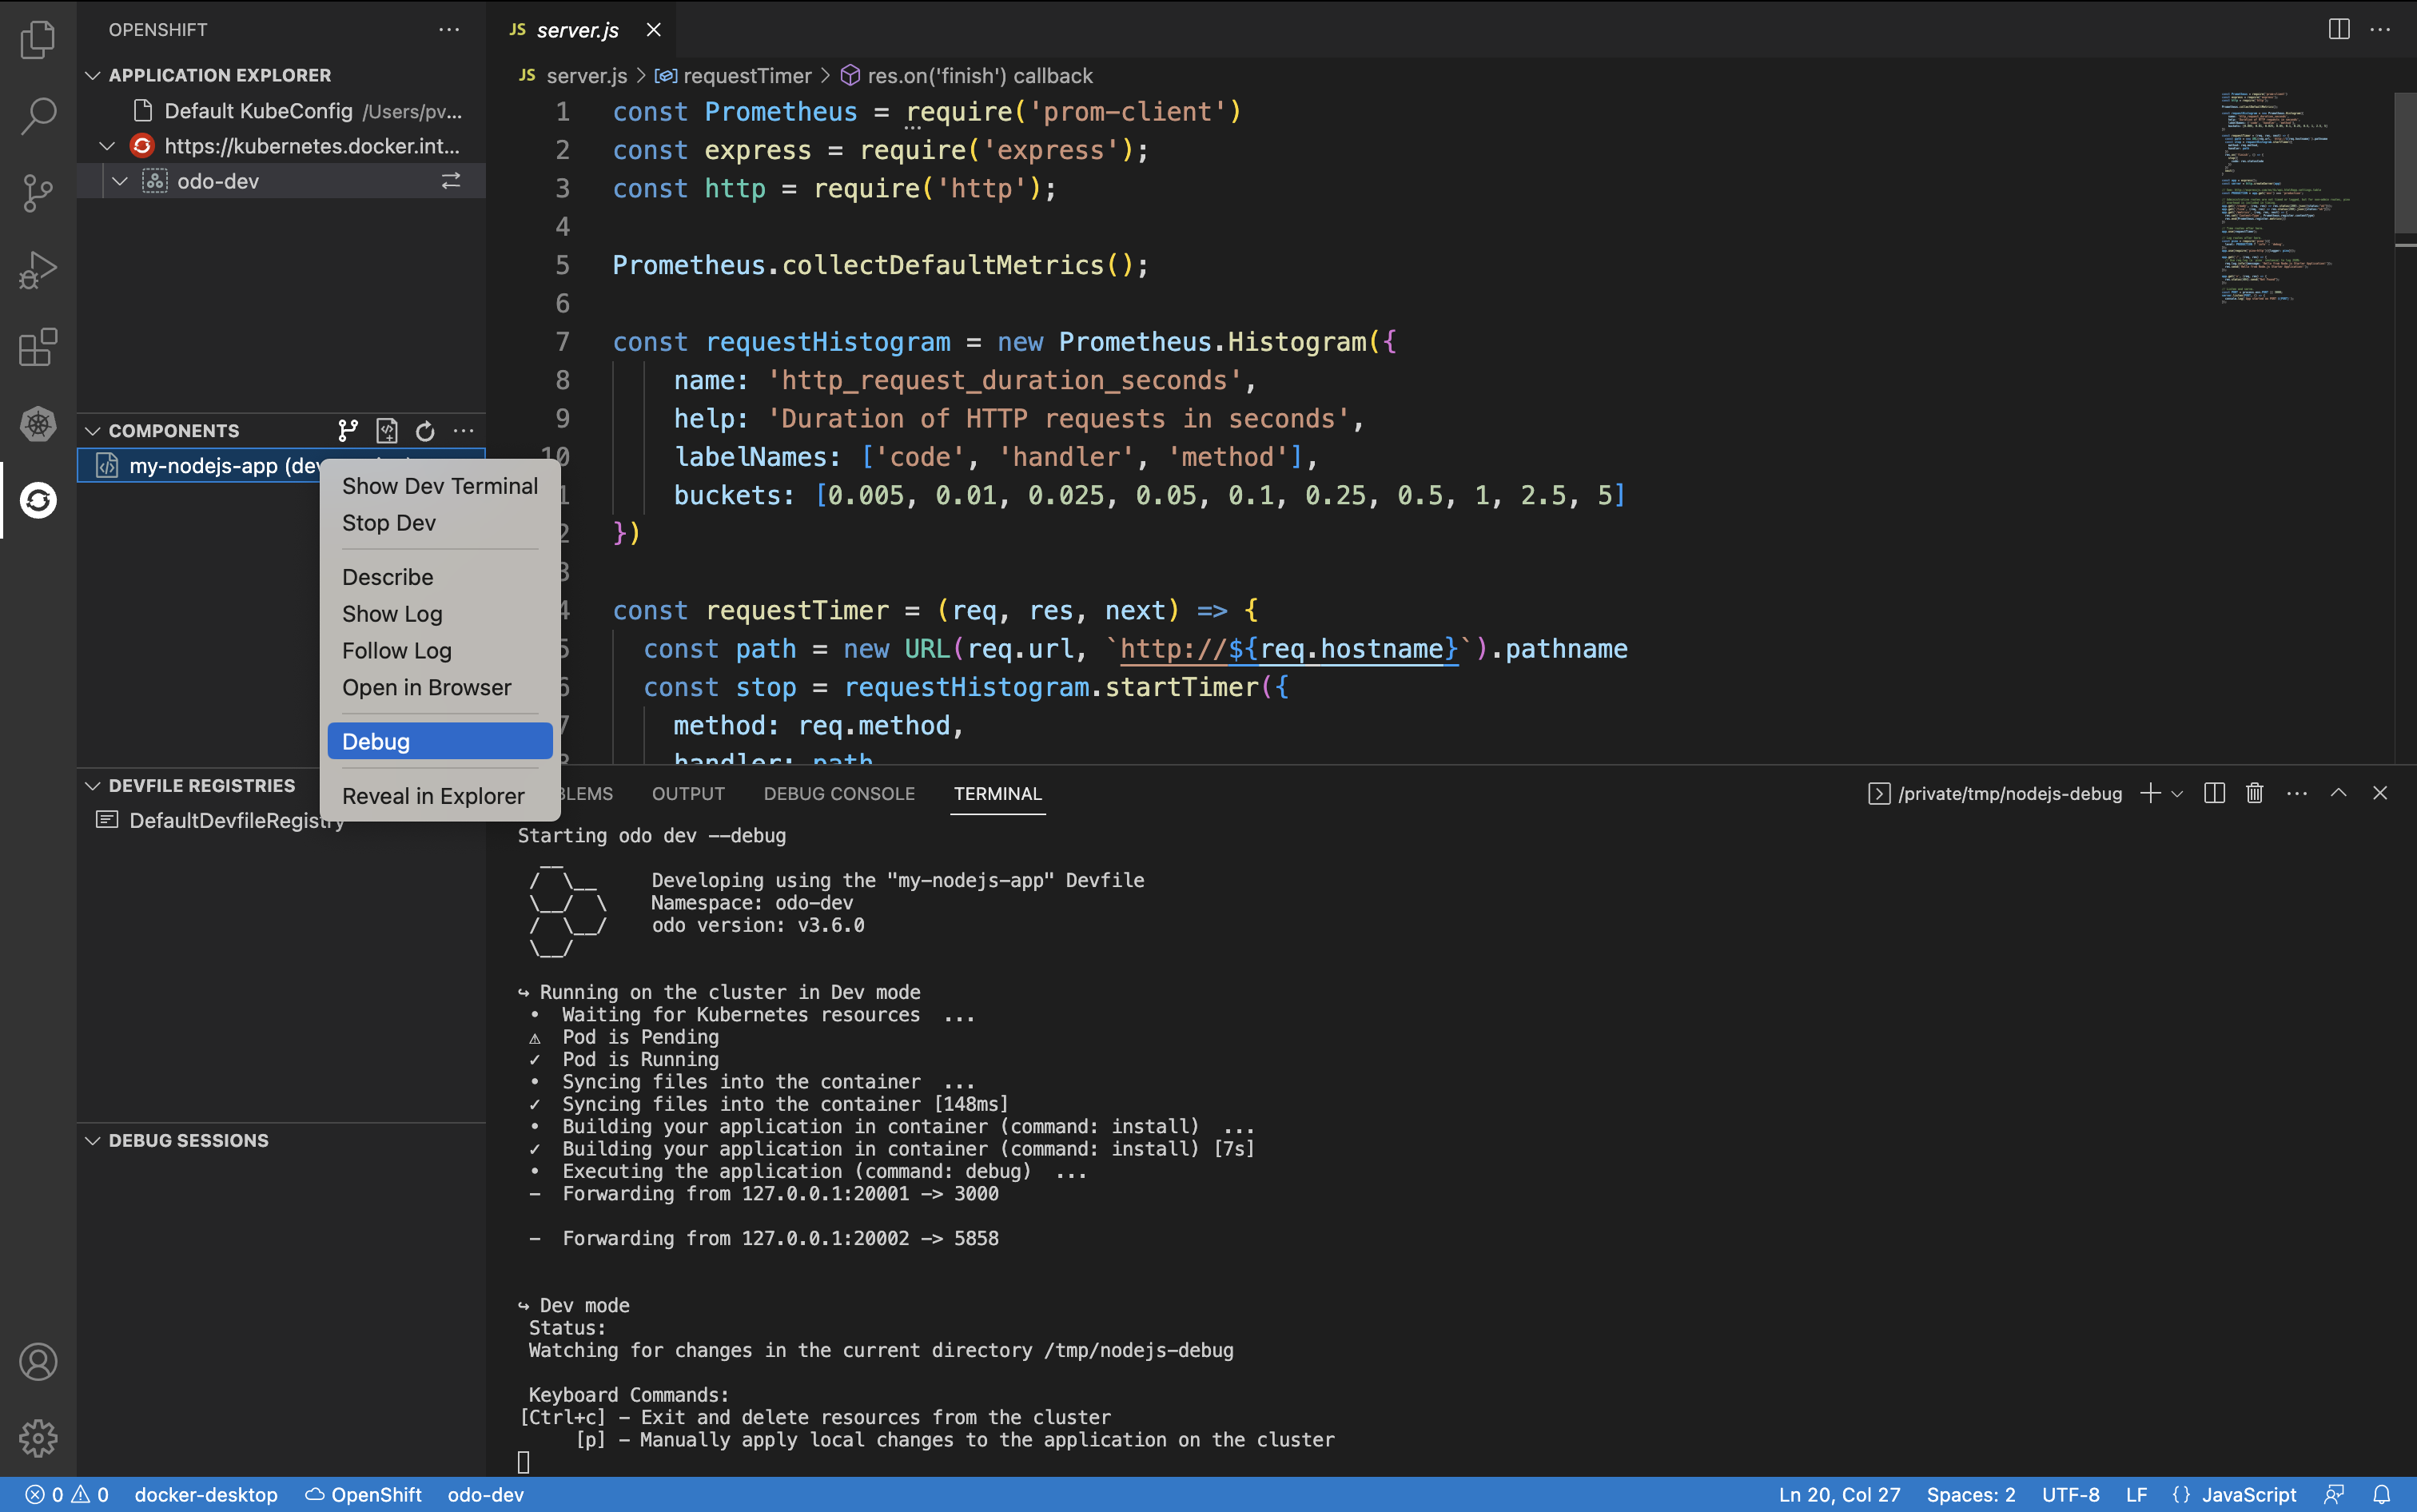
- Debug session should have started successfully in the container at the debug port, in this case, 5858. And you must be looking at the "DEBUG CONSOLE".
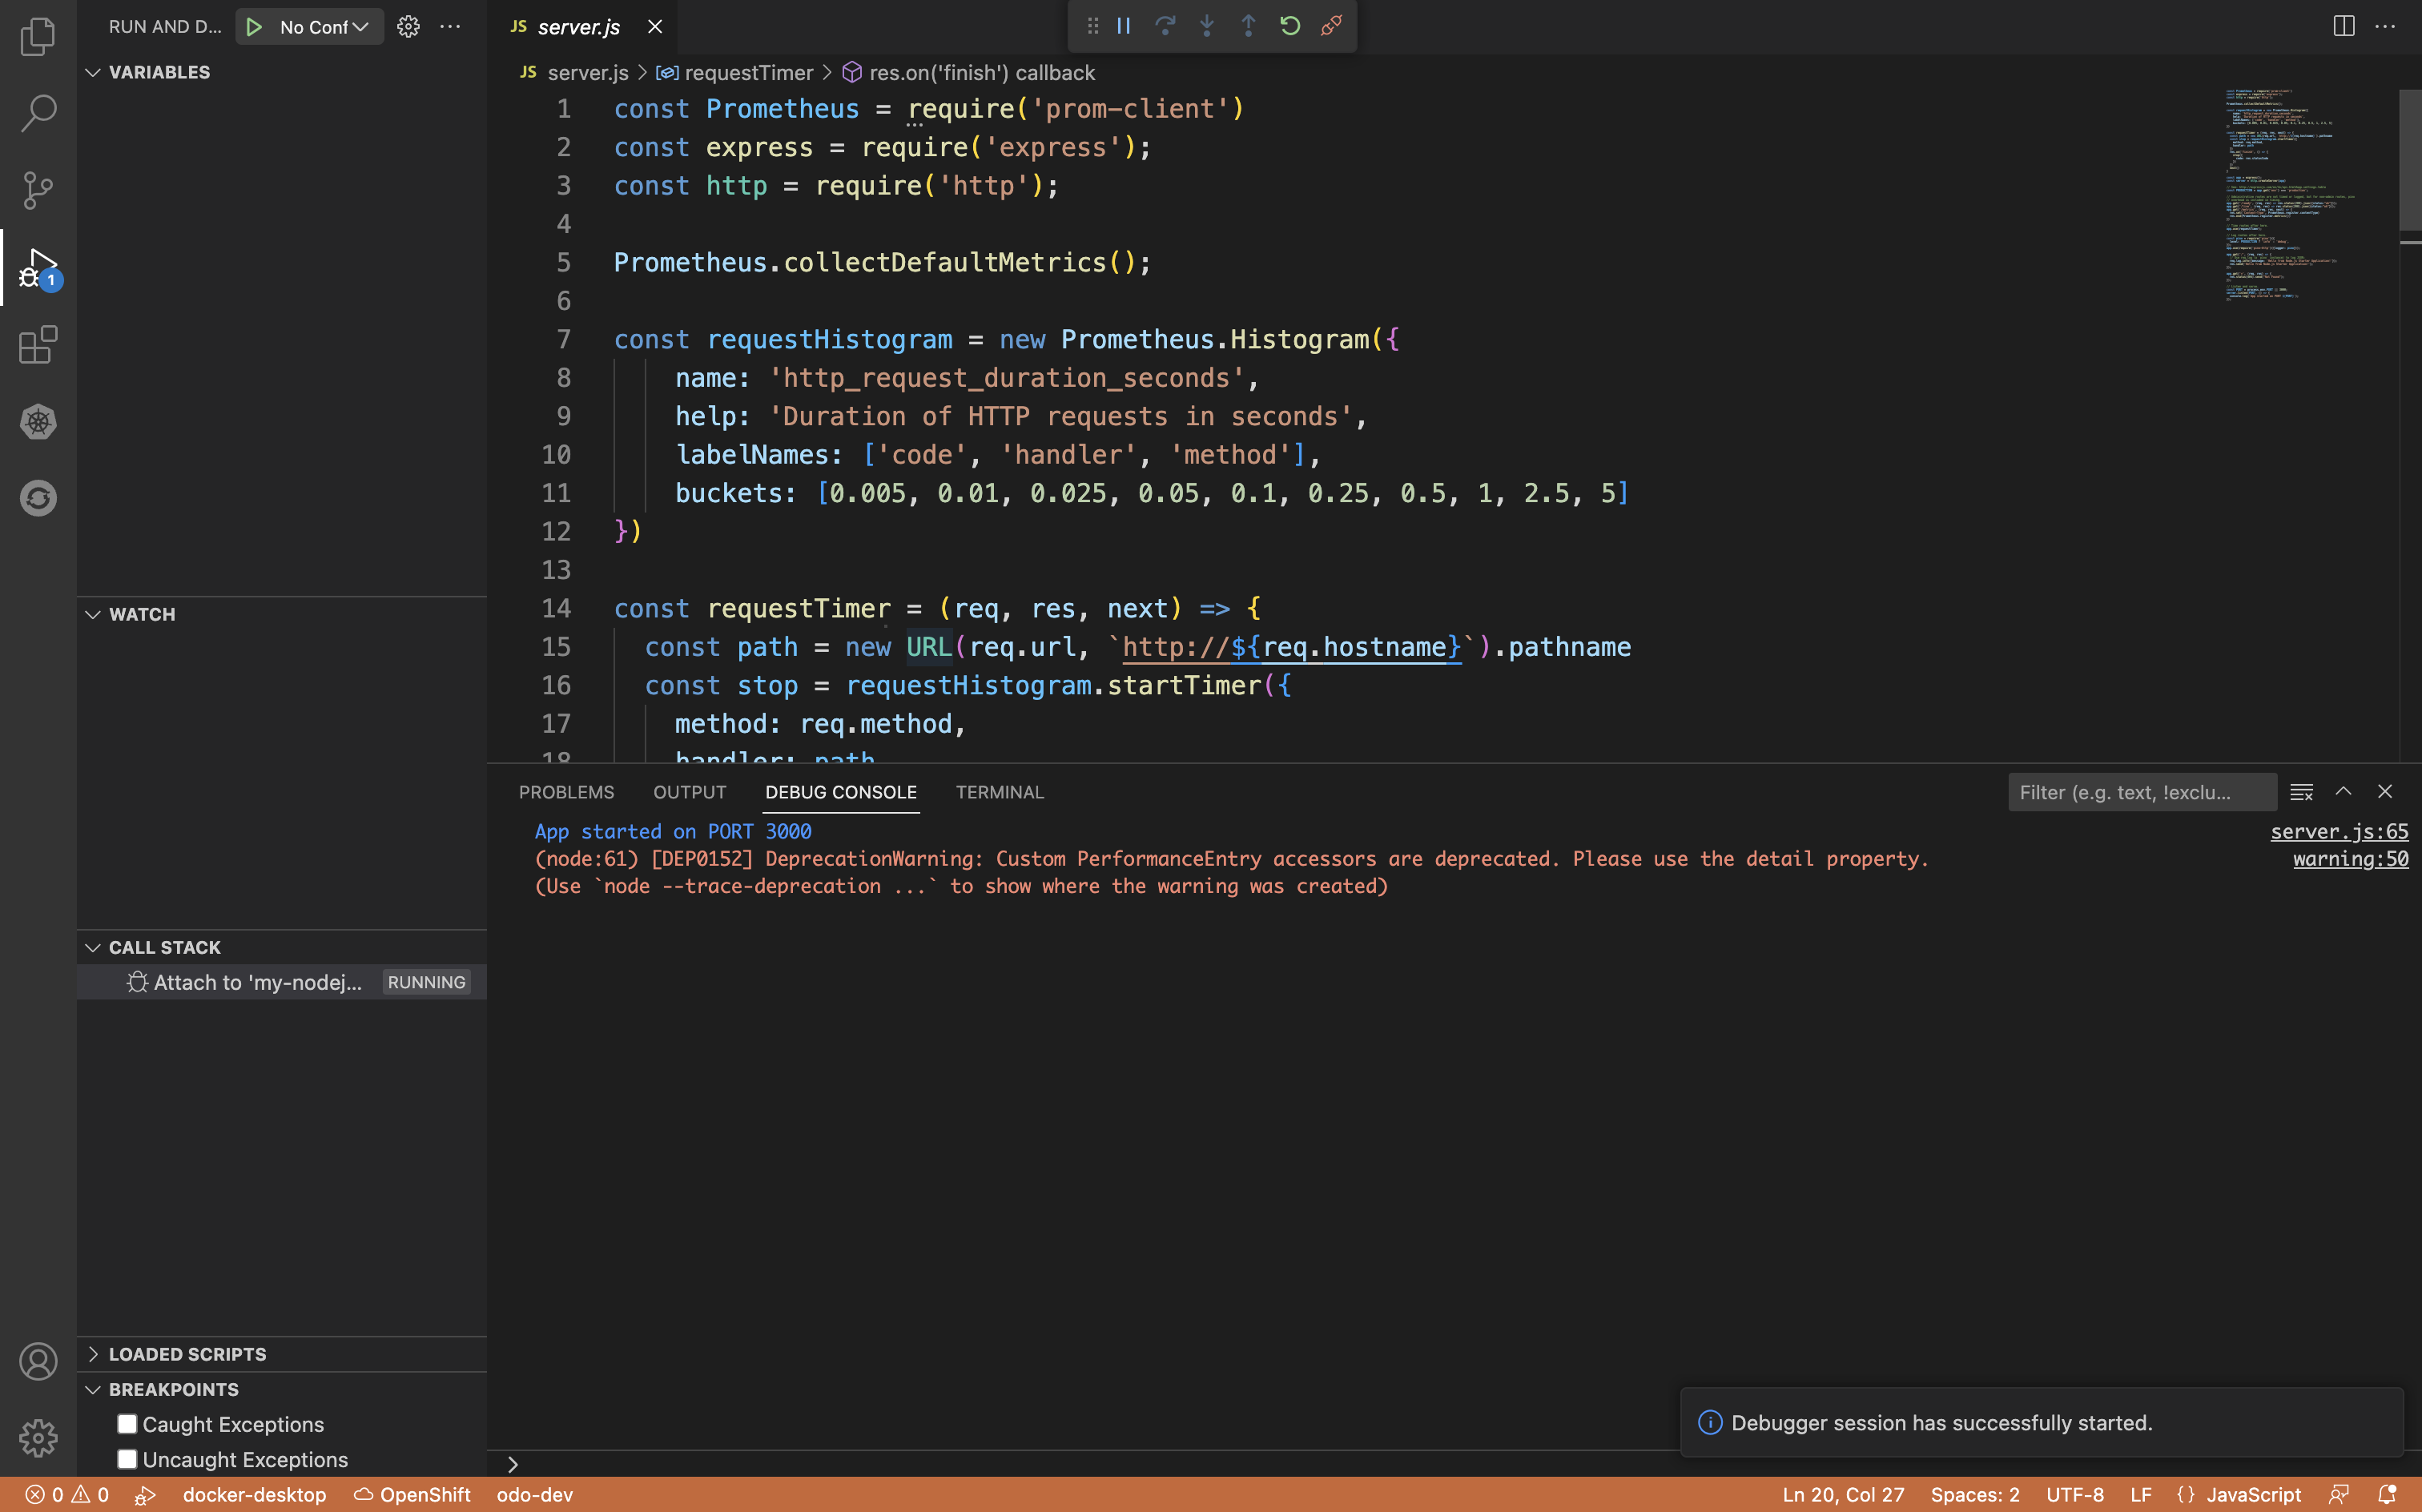
Step 3. Set Breakpoints in the application
Now that the debug session is running, we can set breakpoints in the code.
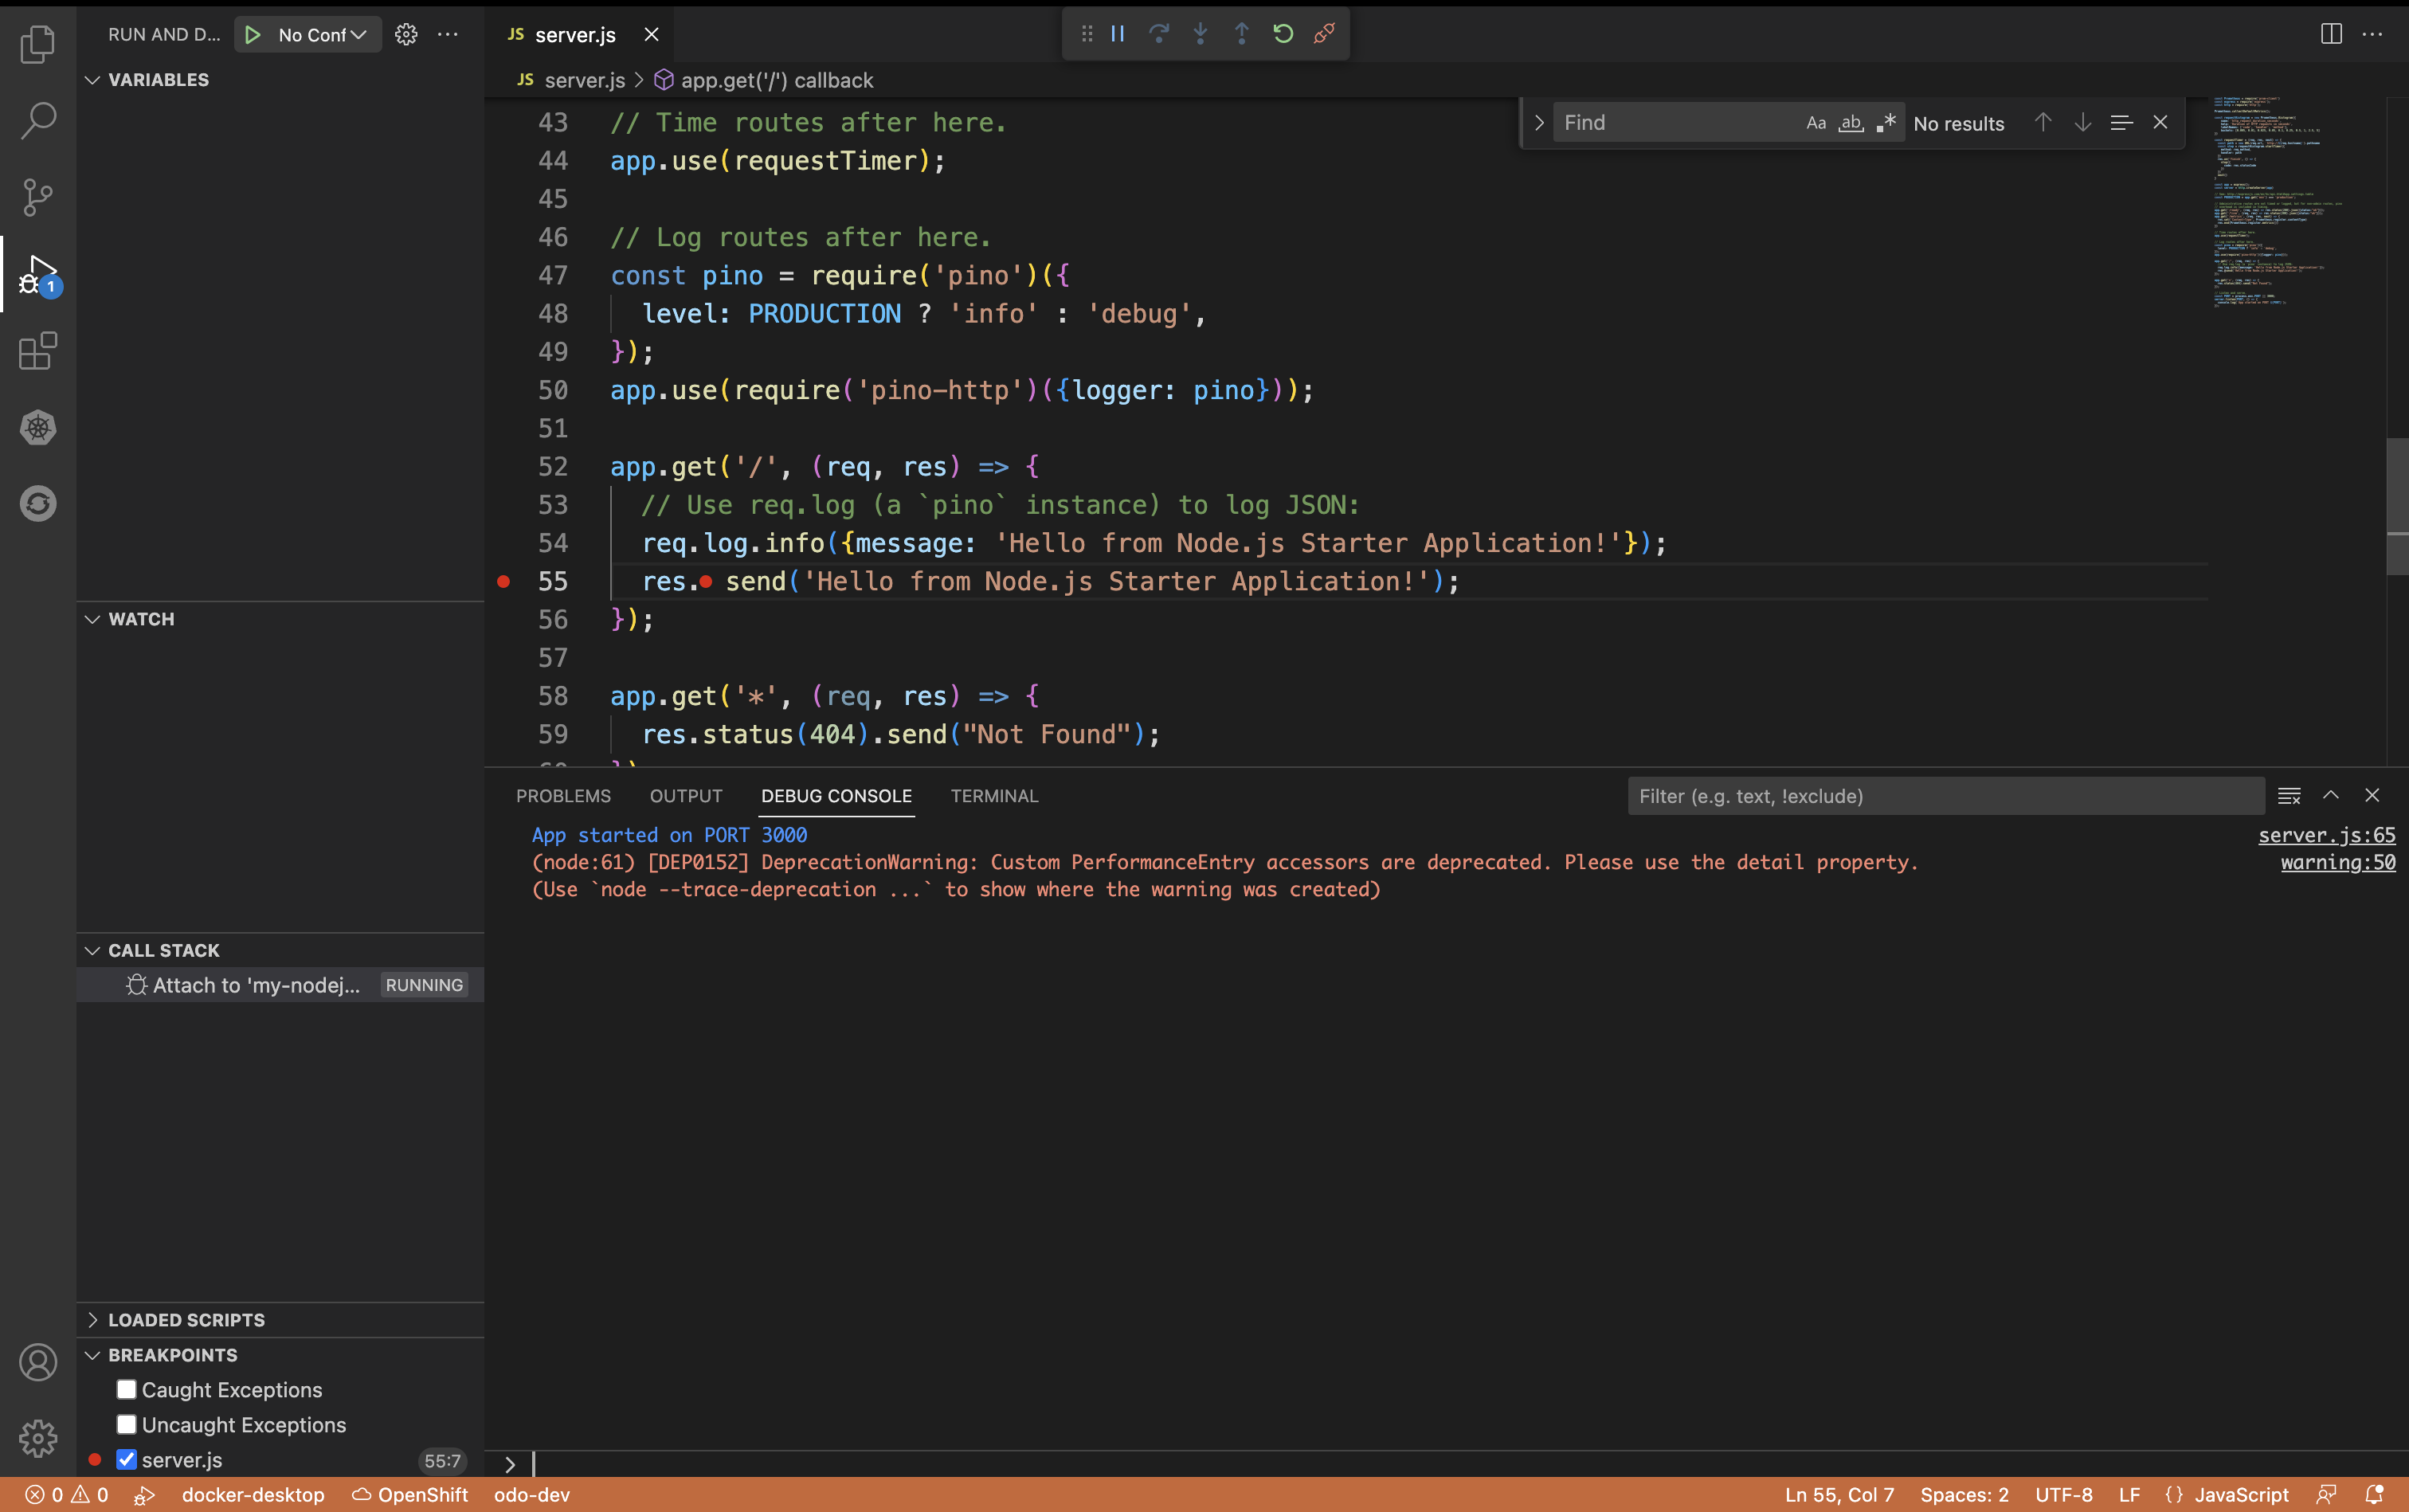
- Open 'server.js' file if you haven't opened it already. We will set a breakpoint on Line 55 by clicking the red dot that appears right next to line numbers.
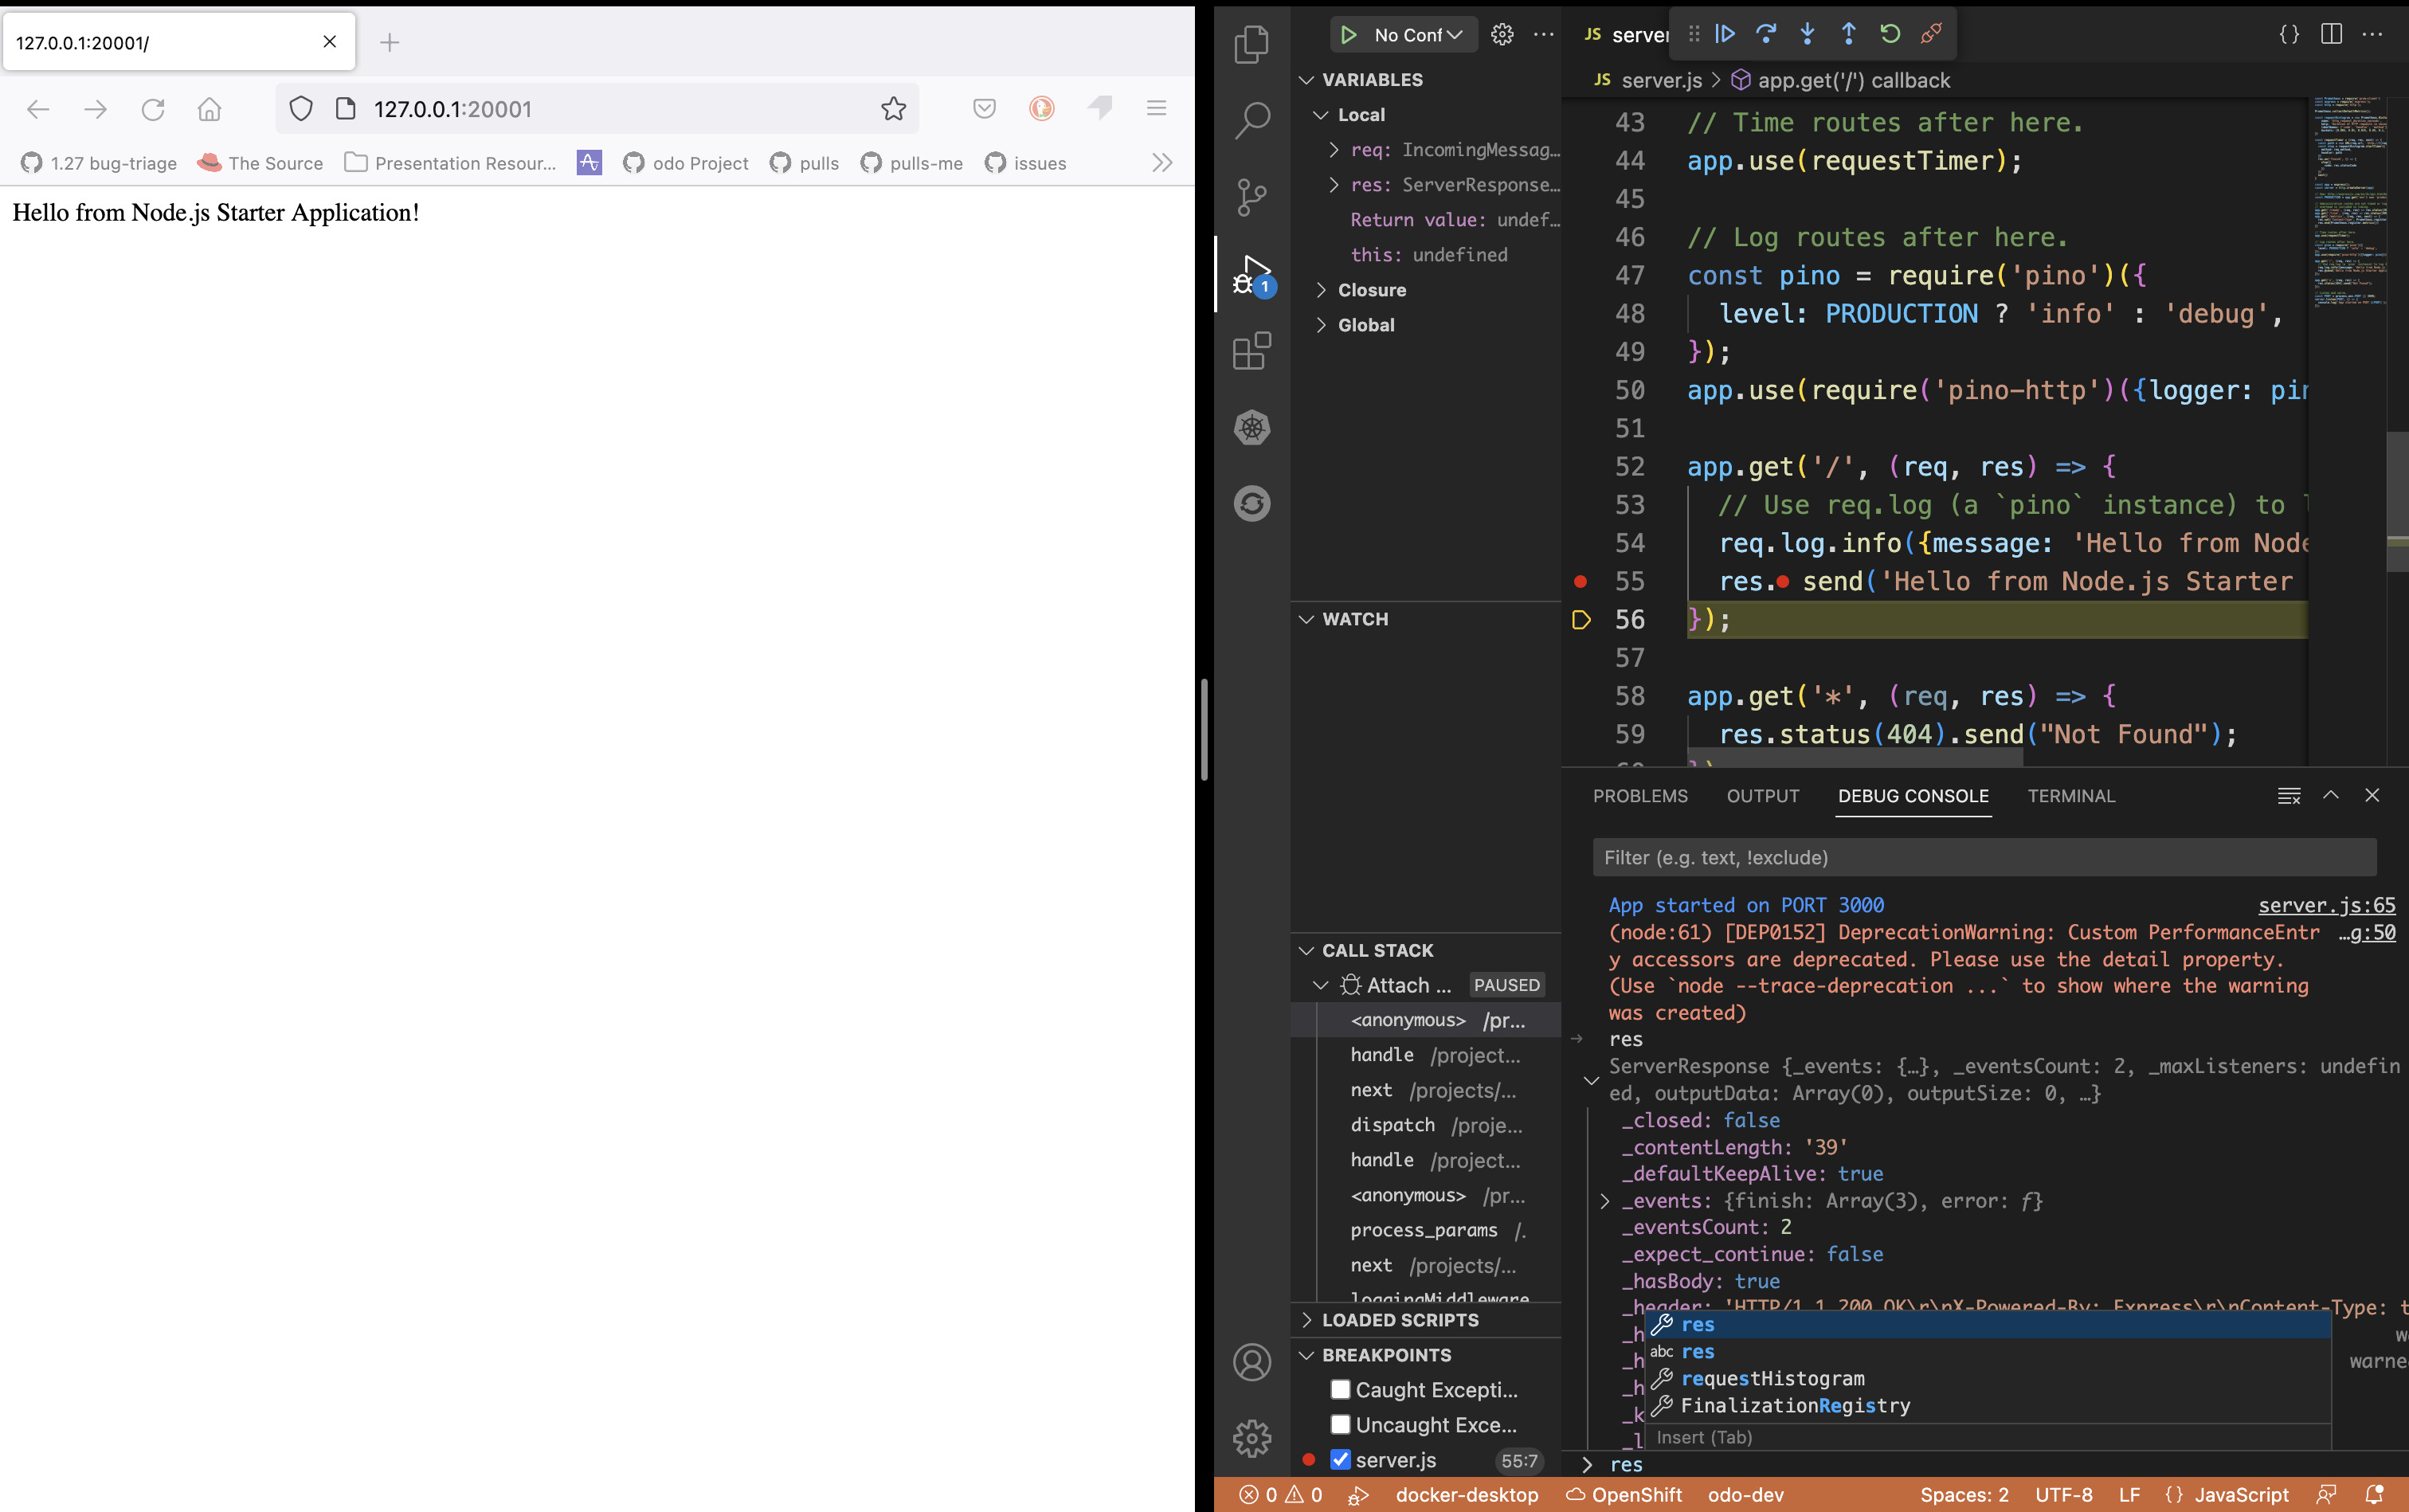
- From a new terminal, or a browser window, ping the URL at which the application is available, in this case, it is 127.0.0.1:20001.
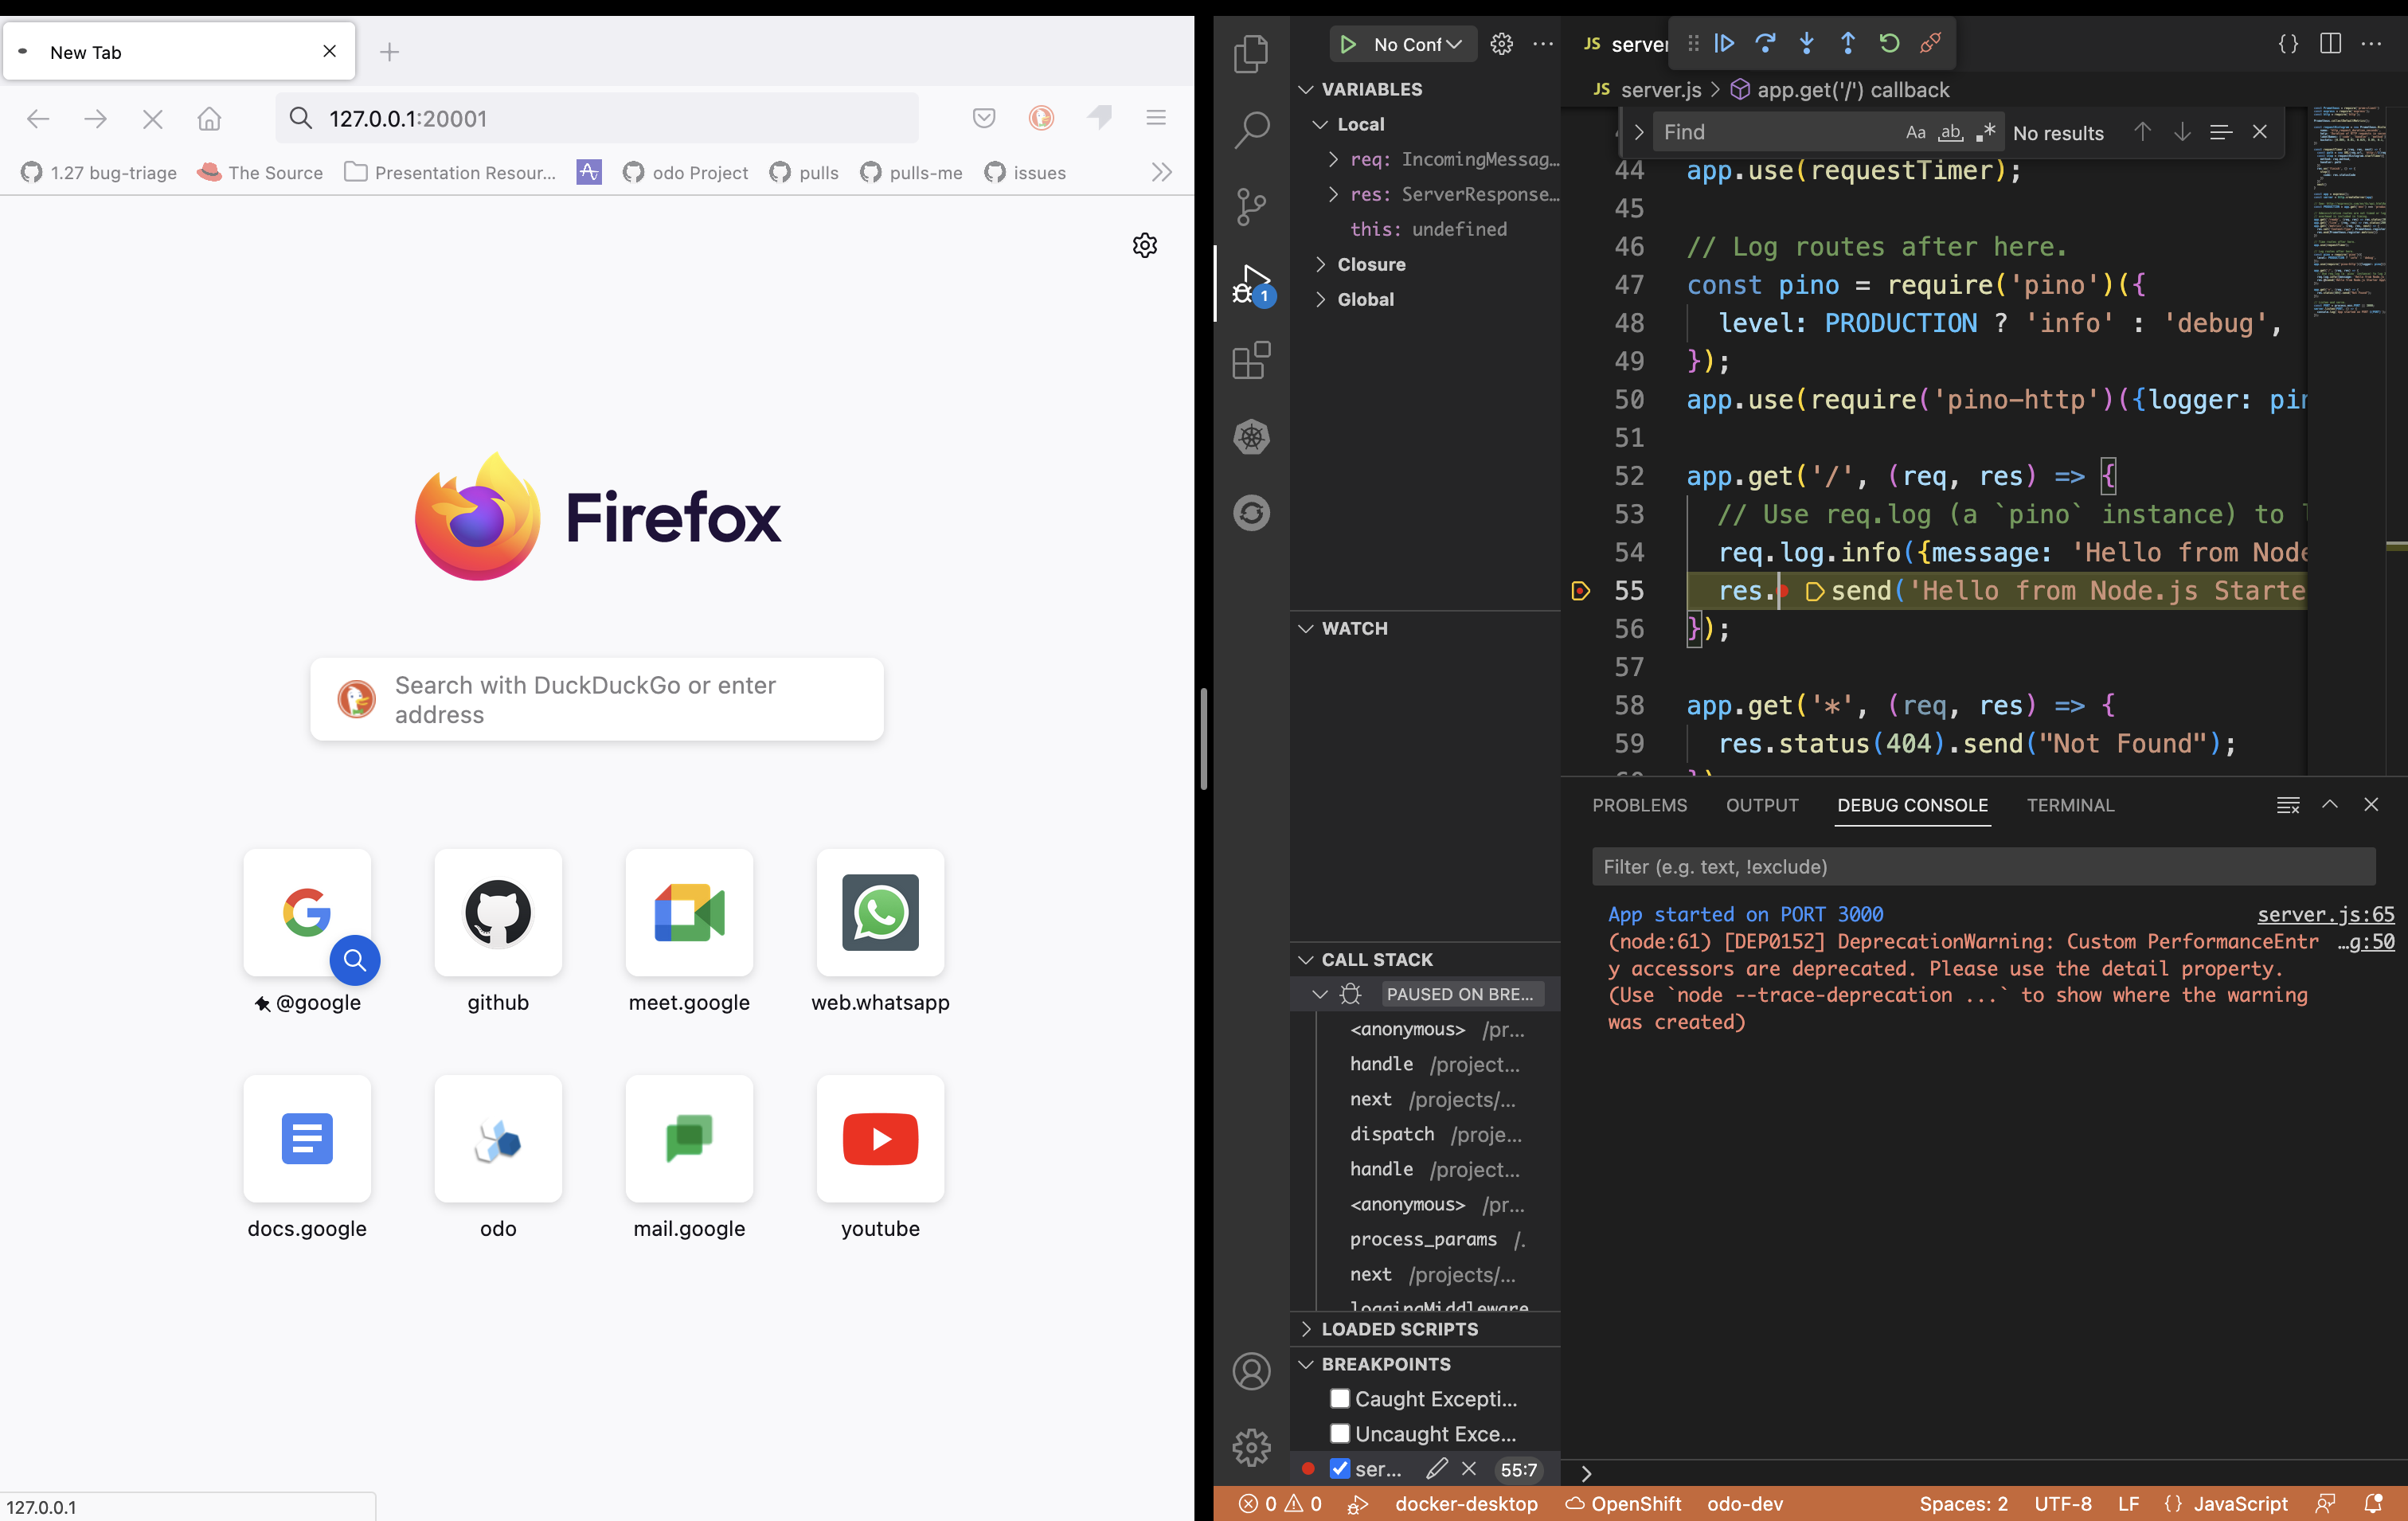
- The debug session should halt execution at the breakpoint, at which point you can start debugging the application.
Configure Devfile to support debugging
Here, we are taking example of a Go devfile that currently does not have a debug command out-of-the-box.
Sample Go Devfile
schemaVersion: 2.1.0
metadata:
  description: "Go is an open source programming language that makes it easy to build simple, reliable, and efficient software."
  displayName: Go Runtime
  icon: https://raw.githubusercontent.com/devfile-samples/devfile-stack-icons/main/golang.svg
  name: go
  projectType: Go
  provider: Red Hat
  language: Go
  tags:
    - Go
  version: 1.0.2
starterProjects:
  - name: go-starter
    description: A Go project with a simple HTTP server
    git:
      checkoutFrom:
        revision: main
      remotes:
        origin: https://github.com/devfile-samples/devfile-stack-go.git
components:
  - container:
      endpoints:
        - name: http-go
          targetPort: 8080
      image: registry.access.redhat.com/ubi9/go-toolset:latest
      args: ["tail", "-f", "/dev/null"]
      memoryLimit: 1024Mi
      mountSources: true
    name: runtime
commands:
  - exec:
      env:
        - name: GOPATH
          value: ${PROJECT_SOURCE}/.go
        - name: GOCACHE
          value: ${PROJECT_SOURCE}/.cache
      commandLine: go build main.go
      component: runtime
      group:
        isDefault: true
        kind: build
      workingDir: ${PROJECT_SOURCE}
    id: build
  - exec:
      commandLine: ./main
      component: runtime
      group:
        isDefault: true
        kind: run
      workingDir: ${PROJECT_SOURCE}
    id: run
- Add an exec command with
group:kindset todebug. The debugger tool you use must be able to start a debug server that we can later on connect to. The binary for your debugger tool should be made available by the container component image.
commands:
- exec:
    env:
    - name: GOPATH
      value: ${PROJECT_SOURCE}/.go
    - name: GOCACHE
      value: ${PROJECT_SOURCE}/.cache
    commandLine: |
        dlv \
          --listen=127.0.0.1:${DEBUG_PORT} \
          --only-same-user=false \
          --headless=true \
          --api-version=2 \
          --accept-multiclient \
          debug --continue main.go
    component: runtime
    group:
      isDefault: true
      kind: debug
    workingDir: ${PROJECT_SOURCE}
  id: debug
For the example above, we use dlv debugger for debugging a Go application and it listens to the port exposed by the environment variable DEBUG_PORT inside the container. The debug command references a container component called "runtime".
- Add Debug endpoint to the container component's
endpointswithexposureset tononeso that it cannot be accessed from outside, and export the debug port number viaDEBUG_PORTenvvariable.
The debug endpoint name must be named debug or be prefixed by debug- so that odo can recognize it as a debug port.
components:
  - container:
      endpoints:
      - name: http-go
        targetPort: 8080
      - exposure: none
        name: debug
        targetPort: 5858
      image: registry.access.redhat.com/ubi9/go-toolset:latest
      args: ["tail", "-f", "/dev/null"]
      env:
      - name: DEBUG_PORT
        value: '5858'
      memoryLimit: 1024Mi
      mountSources: true
    name: runtime
For the example above, we assume that the "runtime" container's image provides the binary for delve debugger. We also add an endpoint called "debug" with targetPort set to 5858 and exposure set to none. We also export debug port number via env variable called DEBUG_PORT.
The final Devfile should look like the following:
Go Devfile configured for debugging
commands:
- exec:
    commandLine: go build main.go
    component: runtime
    env:
    - name: GOPATH
      value: ${PROJECT_SOURCE}/.go
    - name: GOCACHE
      value: ${PROJECT_SOURCE}/.cache
    group:
      isDefault: true
      kind: build
    workingDir: ${PROJECT_SOURCE}
  id: build
- exec:
    commandLine: ./main
    component: runtime
    group:
      isDefault: true
      kind: run
    workingDir: ${PROJECT_SOURCE}
  id: run
- exec:
    env:
    - name: GOPATH
      value: ${PROJECT_SOURCE}/.go
    - name: GOCACHE
      value: ${PROJECT_SOURCE}/.cache
    commandLine: |
        dlv \
          --listen=127.0.0.1:${DEBUG_PORT} \
          --only-same-user=false \
          --headless=true \
          --api-version=2 \
          --accept-multiclient \
          debug --continue main.go
    component: runtime
    group:
      isDefault: true
      kind: debug
    workingDir: ${PROJECT_SOURCE}
  id: debug
components:
- container:
    args:
    - tail
    - -f
    - /dev/null
    endpoints:
    - name: http-go
      targetPort: 8080
    - name: debug
      exposure: none
      targetPort: 5858
    env:
    - name: DEBUG_PORT
      value: '5858'
    image: registry.access.redhat.com/ubi9/go-toolset:latest
    memoryLimit: 1024Mi
    mountSources: true
  name: runtime
metadata:
  description: Go is an open source programming language that makes it easy to build
    simple, reliable, and efficient software.
  displayName: Go Runtime
  icon: https://raw.githubusercontent.com/devfile-samples/devfile-stack-icons/main/golang.svg
  language: Go
  name: my-go-app
  projectType: Go
  provider: Red Hat
  tags:
  - Go
  version: 1.0.2
schemaVersion: 2.1.0
starterProjects:
- description: A Go project with a simple HTTP server
  git:
    checkoutFrom:
      revision: main
    remotes:
      origin: https://github.com/devfile-samples/devfile-stack-go.git
  name: go-starter
Extra Resources
To learn more about running and debugging an application on cluster with OpenShift Toolkit, see the links below.